Does Middle Class Life Cost More Today?
Economists refer to a situation in which the middle class has less money and higher bills as "the middle-class squeeze.”
Costs, 1995–2015
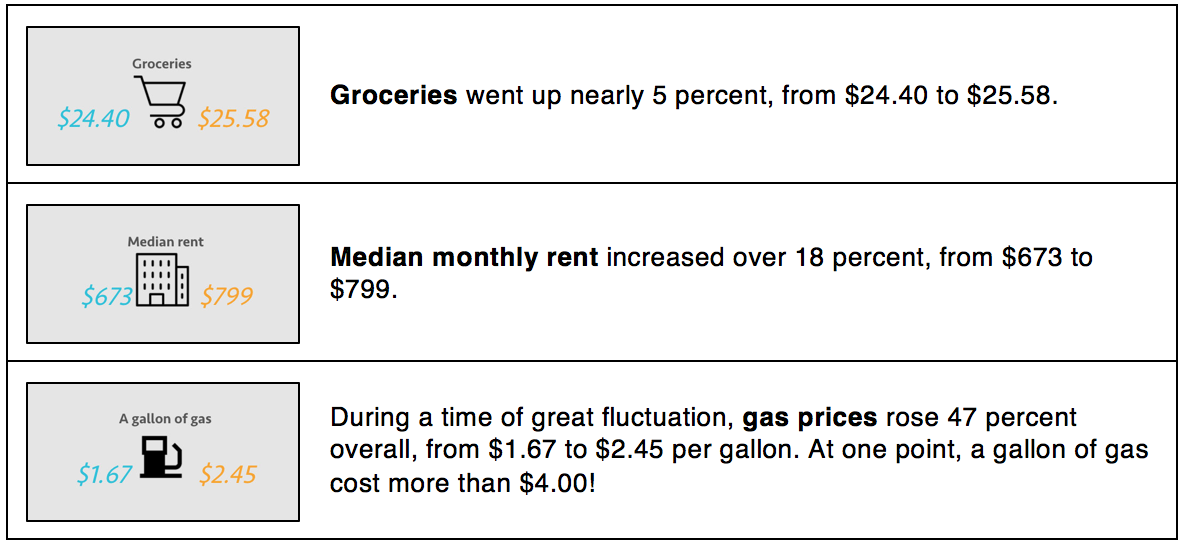
Over the 20-year period between 1995 and 2015, costs in different spending areas have changed. Consider these basic needs: food, shelter, and transportation. Note: All costs cited below have been adjusted for inflation, which allows us to convert historic prices into their equivalent in today’s dollars. Source: Marketplace, using data from the U.S. Bureau of Labor and Statistics and other sources.
Image of a chart showing change in costs in three spending categories between 1995 and 2015. Groceries went up nearly 5 percent, from $24.40 to $25.58. Median monthly rent increased over 18 percent, from $673 to $799. During a time of great fluctuation, gas prices rose 47 percent overall, from $1.67 to $2.45 per gallon. At one point, a gallon of gas cost more than $4.00.
Next, consider these aspirations. Aspirations in this context refer to leisure activities, possessions, or opportunities that people may not need to survive yet are commonly associated with middle class life.
Image of a chart showing change in costs in three spending categories between 1995 and 2015. The cost of a movie ticket went up 27 percent, from $6.74 to $8.58. The cost of home ownership, long considered to be the “gateway to the middle class,” rose 24 percent, from $120,530 to $149,500. Annual college costs (tuition, fees, room and board) jumped 85 percent for public four-year institutions, from $10,552 to $19,548. Costs rose 61 percent for private institutions.
The study that produced this data showed that, combining all categories, middle-class costs rose 30 percent over those two decades.
Household Income, 1995–2015
Now examine the following graph, which shows what happened to household income over that same time. While household income was up overall, how was it in 2015 compared with what is was in 2000? Note: Shaded areas indicate U.S. recessions, or periods of temporary economic decline.

Median U.S. Household Income in Dollars, 1995–2015. Source: U.S. Bureau of the Census and fred.stlouisfed.org
How do you think middle-class spending behaviors might change when prices rise and wages don’t keep up? Use Arrange It to predict the effects of some of these changes.
You must be signed in to save work in this lesson. Log in


